Note
Click here to download the full example code
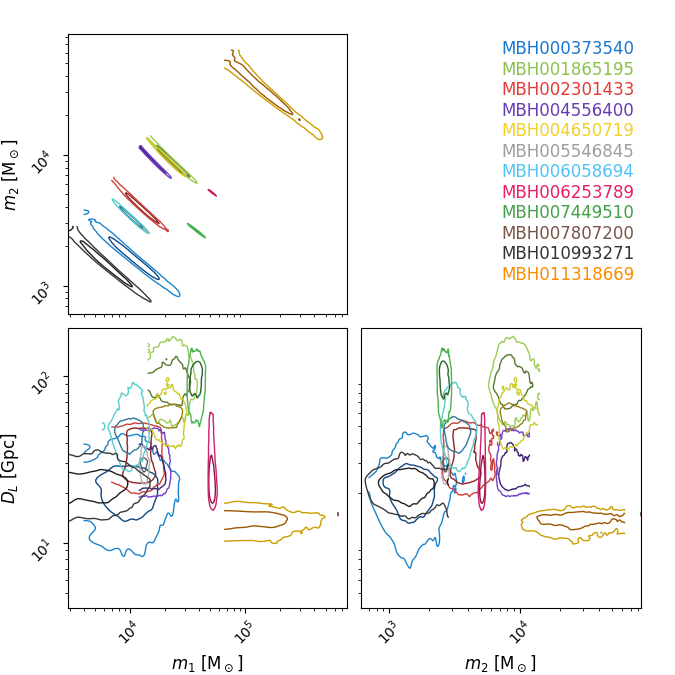
Full catalog corner plots
Corner plot of select parameters for the full catalog.
import matplotlib.pyplot as plt
from chainconsumer import ChainConsumer

from lisacattools.catalog import GWCatalogs
from lisacattools.catalog import GWCatalogType
Load the catalog files
Read individual DataFrames’
meta = catalogs.metadata
sort metadata by observation week, putting most recent catalog last in the list
meta = meta.sort_values(by="observation week")
load the detections of the most recent catalog
last_cat = catalogs.get_last_catalog()
attr_detections = last_cat.get_attr_detections()
detections = last_cat.get_detections(attr_detections)
Create the corner plot with ChainConsumer
c = ChainConsumer()

# selected parameters to plot
parameters = ["Mass 1", "Mass 2", "Luminosity Distance"]

# how parameter names should be formatted in figure
parameter_symbols = [
    r"$m_1\ [{\rm M}_\odot]$",
    r"$m_2\ [{\rm M}_\odot]$",
    r"$D_L\ [{\rm Gpc}]$",
]

sources = last_cat.get_detections()
for source in sources:

    # get chain samples
    samples_attr = last_cat.get_attr_source_samples(source)
    samples = last_cat.get_source_samples(source, samples_attr)

    # get dataframe into numpy array
    df = samples[parameters].values

    # add samples to chainconsumer
    c.add_chain(df, parameters=parameter_symbols, name=source)

# plot!
c.configure(plot_hists=False)
fig = c.plotter.plot(figsize=1.5, log_scales=True)
plt.show()
Total running time of the script: ( 0 minutes 4.162 seconds)