Note
Click here to download the full example code
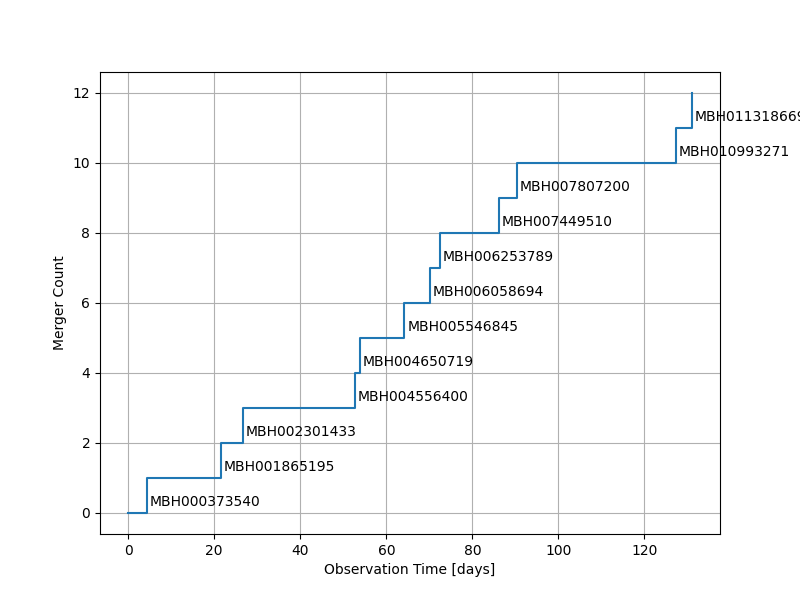
Source list
Display a table of catalog files, detection list, and timeline of mergers..
import matplotlib.pyplot as plt
import numpy as np
from chainconsumer import ChainConsumer

from lisacattools.catalog import GWCatalogs
from lisacattools.catalog import GWCatalogType

# get list catalog files
catPath = "../../tutorial/data/mbh"
catalogs = GWCatalogs.create(GWCatalogType.MBH, catPath, "*.h5")
last_cat = catalogs.get_last_catalog()
Load detections from final catalog. Because catalogs are cummulative, this will include all sources
detections_attr = last_cat.get_attr_detections()
detections = last_cat.get_detections(detections_attr)
detections[["Log Likelihood", "Mass 1", "Mass 2", "Luminosity Distance"]]

detections.sort_values(
    by="Barycenter Merge Time", ascending=True, inplace=True
)
mergeTimes = detections["Barycenter Merge Time"]
mergeT = np.insert(np.array(mergeTimes) / 86400, 0, 0)
mergeCount = np.arange(0, len(mergeTimes) + 1)

# setup plot
fig, ax = plt.subplots(figsize=[8, 6], dpi=100)

# configure axes
ax.step(mergeT, mergeCount, where="post")
ax.set_xlabel("Observation Time [days]")
ax.set_ylabel("Merger Count")
ax.grid()

# loop over events by merger time and make annotated figure
for m in range(0, len(mergeTimes)):
    plt.annotate(
        mergeTimes.index[m],  # this is the text
        (mergeTimes[m] / 86400, mergeCount[m]),  # this is the point to label
        textcoords="offset points",  # how to position the text
        xytext=(2, 5),  # distance from text to points (x,y)
    )
plt.show()
Total running time of the script: ( 0 minutes 0.368 seconds)