Note
Click here to download the full example code
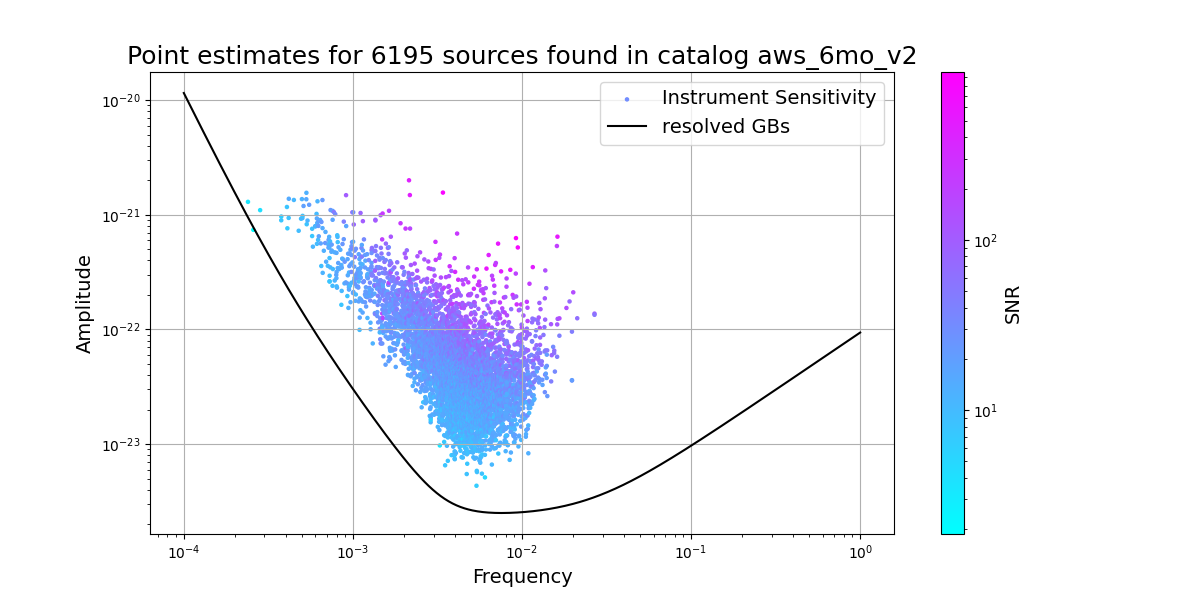
Scatter plots
Scatter plot of detections’ point estimates and LISA sensitivity curve.
Out:
/home/runner/work/lisacattools/lisacattools/docs/examples_ucb/plot_freq_amp.py:46: MatplotlibDeprecationWarning: Unable to determine Axes to steal space for Colorbar. Using gca(), but will raise in the future. Either provide the *cax* argument to use as the Axes for the Colorbar, provide the *ax* argument to steal space from it, or add *mappable* to an Axes.
  cbar = fig.colorbar(scalarMap)
import matplotlib.cm as cm
import matplotlib.colors as colors
import matplotlib.pyplot as plt
import numpy as np

from lisacattools import getSciRD
from lisacattools.catalog import GWCatalogs
from lisacattools.catalog import GWCatalogType

# load catalog
catPath = "../../tutorial/data/ucb"
catalogs = GWCatalogs.create(GWCatalogType.UCB, catPath, "cat15728640_v2.h5")
meta = catalogs.metadata

final_catalog = catalogs.get_last_catalog()
detections_attr = final_catalog.get_attr_detections()
detections = final_catalog.get_detections(detections_attr)


# set up matplotlib figure
fig = plt.figure(figsize=(12, 6), dpi=100)
ax = plt.axes()

plt.yscale("log")
plt.xscale("log")
plt.xlabel("Frequency (Hz)", fontsize=14)
plt.ylabel("Strain Amplitude", fontsize=14)
plt.title(
    "Point estimates for %i sources found in catalog %s"
    % (len(detections), meta.index[0]),
    fontsize=18,
)

# color points in scatter plot by SNR
cNorm = colors.LogNorm(
    vmin=detections["SNR"].min(), vmax=detections["SNR"].max()
)  # re-wrapping normalization
scalarMap = cm.ScalarMappable(norm=cNorm, cmap=plt.cm.get_cmap("cool"))
cbar = fig.colorbar(scalarMap)
cbar.set_label("SNR", fontsize=14)


# the scatter plot
detections.plot(
    kind="scatter",
    x="Frequency",
    y="Amplitude",
    marker=".",
    c=scalarMap.to_rgba(np.array(detections["SNR"])),
    ax=ax,
)

# add sensitivity curve
f = np.logspace(-4, 0, 512)
ax.plot(f, getSciRD(f, meta.iloc[0]["Observation Time"]), color="k")
ax.legend(["Instrument Sensitivity", "resolved GBs"], fontsize=14)
ax.grid()

plt.show()
Total running time of the script: ( 0 minutes 0.635 seconds)