Note
Click here to download the full example code
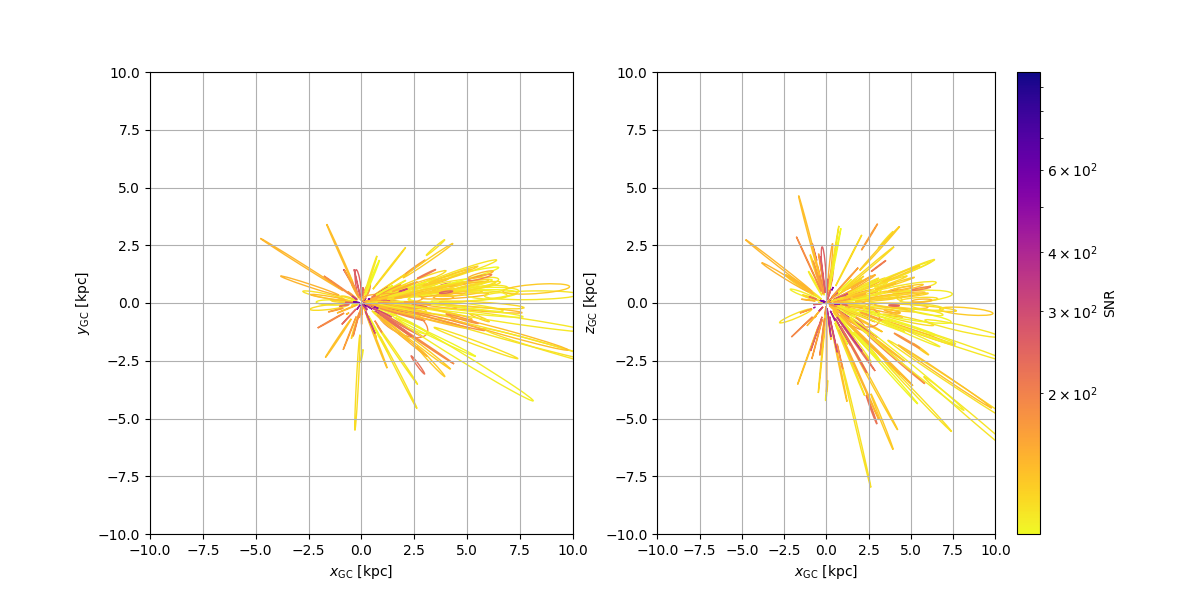
3D map of the galaxy
Create inferred map of the galaxy from chirping binaries
This example demonstrates using chirping binaries to map the galaxy. Samples from the high SNR chirping binaries are reparameterized into galactic cartesian coordinates and plotted. Import modules
import matplotlib.cm as cm
import matplotlib.colors as colors
import matplotlib.pyplot as plt
import numpy as np
from matplotlib.patches import Ellipse

from lisacattools import confidence_ellipse
from lisacattools import convert_ecliptic_to_galactic
from lisacattools import convert_galactic_to_cartesian
from lisacattools import get_DL
from lisacattools.catalog import GWCatalogs
from lisacattools.catalog import GWCatalogType

# Start by loading the main catalog file processed from GBMCMC outputs
catPath = "../../tutorial/data/ucb"
catalogs = GWCatalogs.create(GWCatalogType.UCB, catPath, "cat15728640_v2.h5")
final_catalog = catalogs.get_last_catalog()
detections_attr = final_catalog.get_attr_detections()
detections = final_catalog.get_detections(detections_attr)

# Get dataframe of only high SNR chirping events
selected_detections = detections[
    (detections["Frequency Derivative"] > 0) & (detections["SNR"] > 100)
]

# set up the figure
fig, axs = plt.subplots(1, 2, figsize=(12, 6), dpi=100)

axs[0].grid()
axs[1].grid()

axs[0].set(
    xlim=(-10, 10),
    ylim=(-10, 10),
    xlabel=r"$x_{\rm GC}\ [{\rm kpc}]$",
    ylabel=r"$y_{\rm GC}\ [{\rm kpc}]$",
)
axs[1].set(
    xlim=(-10, 10),
    ylim=(-10, 10),
    xlabel=r"$x_{\rm GC}\ [{\rm kpc}]$",
    ylabel=r"$z_{\rm GC}\ [{\rm kpc}]$",
)


# color ellipses by log SNR
cNorm = colors.LogNorm(
    vmin=selected_detections["SNR"].min(),
    vmax=selected_detections["SNR"].max(),
)
scalarMap = cm.ScalarMappable(norm=cNorm, cmap=plt.cm.get_cmap("plasma_r"))
cbar = fig.colorbar(scalarMap)
cbar.set_label("SNR")

# plot 1-sigma ellipses of 3D localization for each source
sources = list(selected_detections.index)
for source in sources:

    # get chain samples
    samples = final_catalog.get_source_samples(source)
    # convert from ecliptic to galactic coordinates
    convert_ecliptic_to_galactic(samples)
    # enforce GR prior
    samples = samples[samples["Frequency Derivative"] > 0]
    # add distance parameter
    get_DL(samples)

    # add galactic cartesian coordinates
    convert_galactic_to_cartesian(
        samples,
        "Galactic Longitude",
        "Galactic Latitude",
        "Luminosity Distance",
    )

    # plot galactic X-Y plane
    confidence_ellipse(
        samples[["X", "Y"]],
        axs[0],
        n_std=1.0,
        edgecolor=scalarMap.to_rgba(np.array(detections.loc[source].SNR)),
        linewidth=1.0,
    )

    # plot galactic X-Z plane
    confidence_ellipse(
        samples[["X", "Z"]],
        axs[1],
        n_std=1.0,
        edgecolor=scalarMap.to_rgba(np.array(detections.loc[source].SNR)),
        linewidth=1.0,
    )


plt.show()
Out:
/home/runner/work/lisacattools/lisacattools/docs/examples_ucb/plot_galactic_coordinates.py:63: MatplotlibDeprecationWarning: Unable to determine Axes to steal space for Colorbar. Using gca(), but will raise in the future. Either provide the *cax* argument to use as the Axes for the Colorbar, provide the *ax* argument to steal space from it, or add *mappable* to an Axes.
  cbar = fig.colorbar(scalarMap)
Total running time of the script: ( 0 minutes 18.639 seconds)