Note
Click here to download the full example code
Connecting catalogs
Locate a source in an updated catalog and compare parameters.
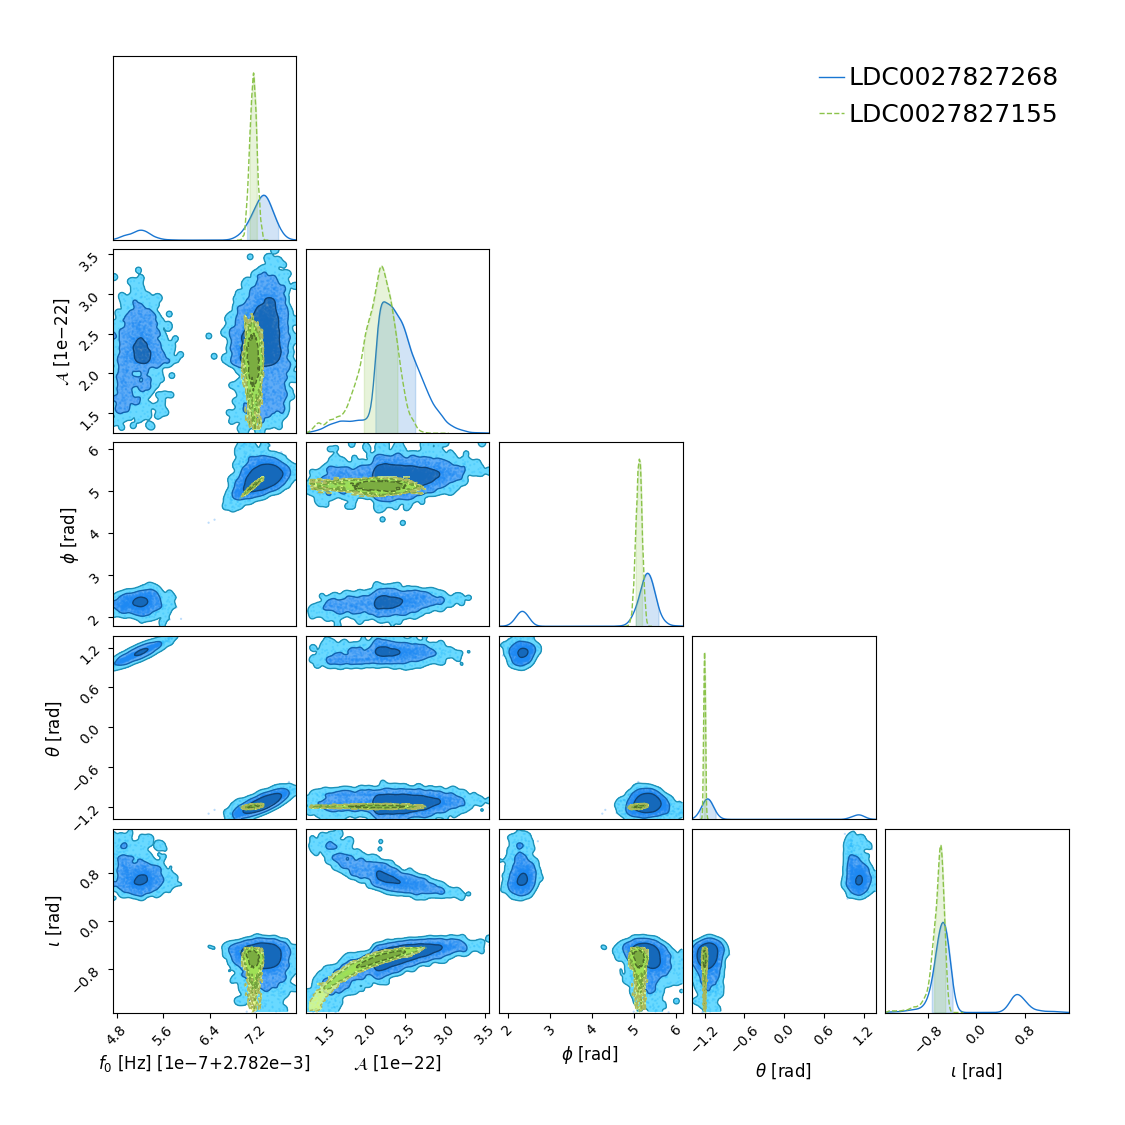
This example shows how to find a particular source after the catalog has been updated based on the parent meta data, and produces a corner plot showing how the parameter estimation evolves with time.
import os

import numpy as np
import pandas as pd
from chainconsumer import ChainConsumer

from lisacattools.catalog import GWCatalog
from lisacattools.catalog import GWCatalogs
from lisacattools.catalog import GWCatalogType
Start by loading the 03 month catalog and selecting a source to follow
catPath = "../../tutorial/data/ucb"

meta_catalog = GWCatalogs.create(
    GWCatalogType.UCB, catPath, "cat7864320_v3.h5"
)
old_catalog = meta_catalog.get_last_catalog()

detections_attr = old_catalog.get_attr_detections()
old_cat = old_catalog.get_detections(detections_attr)

# pick a source, any source
old_source = "LDC0027827268"
sample_attr = old_catalog.get_attr_source_samples(old_source)
old_samples = old_catalog.get_source_samples(old_source, sample_attr)

old_cat.loc[[old_source], ["SNR", "Frequency", "Amplitude"]]
Load the 06 month catalog and find the current name for old_source
meta_catalog = GWCatalogs.create(
    GWCatalogType.UCB, catPath, "cat15728640_v2.h5"
)
new_catalog = meta_catalog.get_last_catalog()

detections_attr = new_catalog.get_attr_detections()
new_cat = new_catalog.get_detections(detections_attr)

# select source that lists old_source as parent
new_cat = new_cat[(new_cat["parent"] == old_source)]
new_source = new_cat.index.values[0]

sample_attr = new_catalog.get_attr_source_samples(new_source)
new_samples = new_catalog.get_source_samples(new_source, sample_attr)

new_cat.loc[[new_source], ["parent", "SNR", "Frequency", "Amplitude"]]
Plot the posteriors for the 03 and 06 months inferences for the source
c = ChainConsumer()

# Select which parameters to plot & format the axes labels
parameters = [
    "Frequency",
    "Amplitude",
    "Ecliptic Longitude",
    "Ecliptic Latitude",
    "Inclination",
]
parameter_labels = [
    r"$f_0\ [{\rm Hz}]$",
    r"$\mathcal{A}$",
    r"$\phi\ [{\rm rad}]$",
    r"$\theta\ [{\rm rad}]$",
    r"$\iota\ [{\rm rad}]$",
]


# add chains
c.add_chain(
    old_samples[parameters].values,
    parameters=parameter_labels,
    cloud=True,
    name=old_source,
)
c.add_chain(
    new_samples[parameters].values,
    parameters=parameter_labels,
    cloud=True,
    name=new_source,
)

# plot!
c.configure(
    sigmas=[1, 2, 3],
    linestyles=["-", "--"],
    legend_color_text=False,
    legend_kwargs={"fontsize": 18},
)
fig = c.plotter.plot(figsize=1.5)
Total running time of the script: ( 0 minutes 2.724 seconds)