Note
Click here to download the full example code
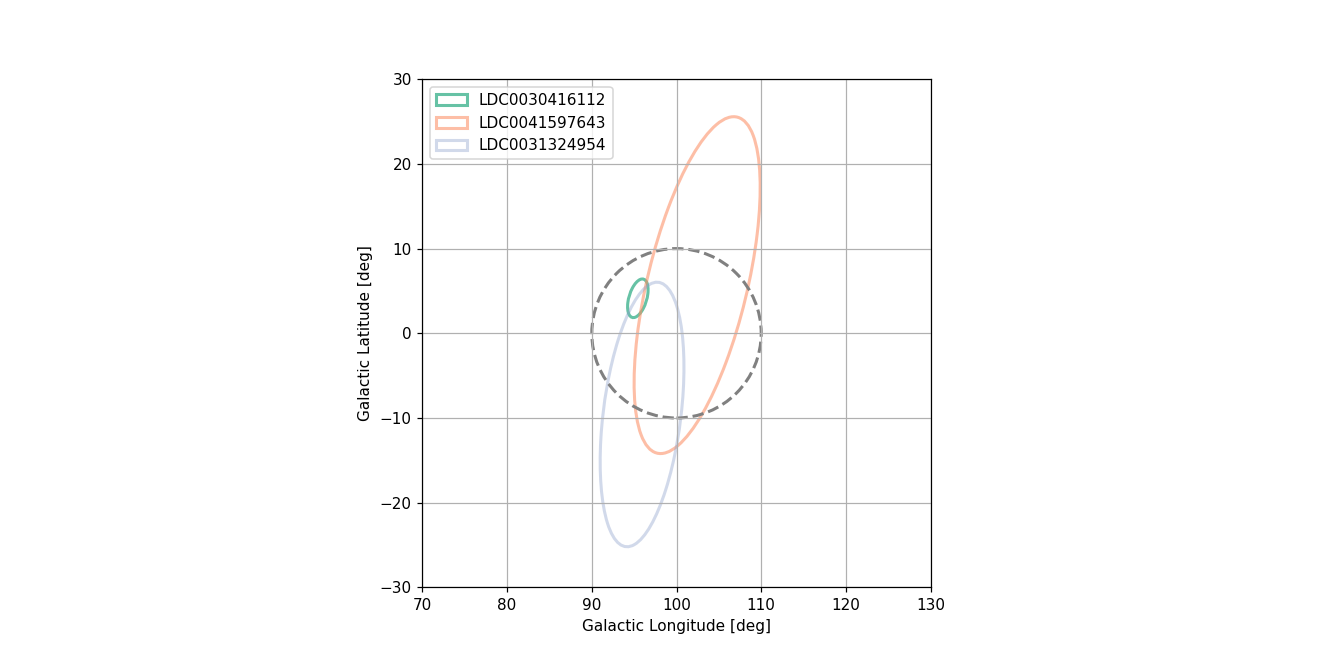
Select Sources in Sky Region
Plot 2-sigma contours of all sources consistent with input error circle on the sky in galactic coordinates.
import logging
import sys

import healpy as hp
import matplotlib.cm as cm
import matplotlib.colors as colors
import matplotlib.pyplot as plt
import numpy as np
from matplotlib.patches import Ellipse

from lisacattools import confidence_ellipse
from lisacattools import convert_ecliptic_to_galactic
from lisacattools import OFF
from lisacattools.catalog import GWCatalogs
from lisacattools.catalog import GWCatalogType
from lisacattools.utils import HPbin
from lisacattools.utils import HPhist

logger = logging.getLogger("lisacattools")
logger.setLevel(
    OFF
)  # Set the logger to OFF. By default, the logger is set to INFO

# Start by loading the main catalog file processed from GBMCMC outputs
catType = GWCatalogType.UCB  # catalog type (UCB or MBH)
catPath = "../../tutorial/data/ucb"  # path to catalog files
catName = "cat15728640_v2.h5"

catalogs = GWCatalogs.create(catType, catPath, catName)
catalog = catalogs.get_last_catalog()
detections_df = catalog.get_dataset("detections")
Define error cirlce on the sky from which we will select catalog entries. Two circles are defined, one with larger radius by a constant factor scale. The large circle is used to filter the full list of sources based on point-estimates. The smaller circle defines the region where we select the posterior samples.
# this is the error circle we are querying
lat_deg = 0
lon_deg = 100
rad_deg = 10
scale = 3  #

# convert to spherical polar radians and map region on the sky to array of healpix indices
nside = 32

theta = 0.5 * np.pi - np.deg2rad(lat_deg)
phi = np.deg2rad(lon_deg)

# define error circles for selecting catalog entires
centroid = hp.ang2vec(theta, phi)  # center point in xyz
err_circle_search = hp.query_disc(
    nside, centroid, np.deg2rad(rad_deg) * scale
)  # large circle for filtering point estimates
err_circle_select = hp.query_disc(
    nside, centroid, np.deg2rad(rad_deg)
)  # target circle for selecting samples
Filter catalog entries that are consistent with the error circle, and compute their posterior mass contained within.
# filter detections on err_circle_search
HPbin(detections_df, nside)
detections_df["target"] = detections_df["HEALPix bin"].isin(err_circle_search)


# pick out the subset that have a point estimate  inside of err_circle_search
targets_df = detections_df[detections_df["target"] == True]

# loop over each target source & compute fraction of posterior in err_circle_select
targets = list(targets_df.index)
pmatch = list()

for target in targets:

    # get chain samples
    samples = catalog.get_source_samples(target)
    n_total = len(samples.index)

    # healpix binning of chain samples
    HPbin(samples, nside)

    # check if sample is inside of err_circle_select
    samples["match"] = samples["HEALPix bin"].isin(err_circle_select)
    samples_match = samples[samples["match"] == True]
    n_match = len(samples_match.index)

    # save fraction of posterior samples inside of err_circle_select
    n_frac = n_match / n_total
    pmatch.append(n_frac)

# add column to DataFrame w/ fraction of posterior samples pmatch
targets_df.insert(0, "Pmatch", pmatch)
Cut sources based on posterio mass in err_circle_select and display the surviving candidates in table form.
# only keep sources with > 10% posterior mass contained wthin err_circle_select
targets_df_cut = targets_df[(targets_df["Pmatch"] > 0.1)]
targets_df_cut = targets_df_cut.sort_values(by="Pmatch", ascending=False)
targets_df_cut[
    ["Pmatch", "SNR", "Frequency", "Frequency Derivative", "cosinc"]
]
Plot the 2-sigma contours of the target circles consistent with the error circle
# set up the figure
fig = plt.figure(figsize=(12, 6), dpi=110)
ax = plt.axes()
ax.grid()

# dynamically set scale of plot
delta = 3 * rad_deg
ax.set(
    xlim=(lon_deg - delta, lon_deg + delta),
    ylim=(lat_deg - delta, lat_deg + delta),
    xlabel="Galactic Longitude [deg]",
    ylabel="Galactic Latitude [deg]",
    aspect="equal",
)

# set color of sigma contours by inclusion fraction
cmap = plt.get_cmap("Set2")
rgb_cm = cmap.colors  # returns array-like color

# loop over all target sources adding 1- and 2-sigma contours to plot
targets = list(targets_df_cut.index)
for i, target in enumerate(targets):

    # get chain samples
    samples = catalog.get_source_samples(target)

    # convert from ecliptic to galactic coordinates
    convert_ecliptic_to_galactic(samples)

    # get Pmatch value for current target
    Pmatch = targets_df_cut.loc[target].Pmatch

    # get centroid and 2-sigma contours in galactic coordinates, add to plot
    confidence_ellipse(
        samples[["Galactic Longitude", "Galactic Latitude"]],
        ax,
        n_std=2,
        edgecolor=rgb_cm[i % len(rgb_cm)],
        alpha=Pmatch,
        linewidth=2,
        label=target,
    )

ax.legend(targets)

# plot the target error circle
error_circle = plt.Circle(
    (lon_deg, lat_deg),
    rad_deg,
    color="gray",
    fill=False,
    linestyle="--",
    linewidth=2,
)
ax.add_patch(error_circle)

plt.show()
Total running time of the script: ( 0 minutes 2.313 seconds)